Turbomaps is becoming good at drawing maps
It’s been a few months since the last update, and Turbomaps is getting closer to a public release. Here’s some of what you can expect when it launches.

You can draw all sorts of shapes!
There’s a whole bunch of tools to make it easy to create your own map data—you can scribble a path on a map, or get more accurate with the line, rectangle, and point drawing tools. The software is also pretty forgiving if you make a mistake—you can double click to edit the individual points that make up a layer, or just use Ctrl+Z to undo.
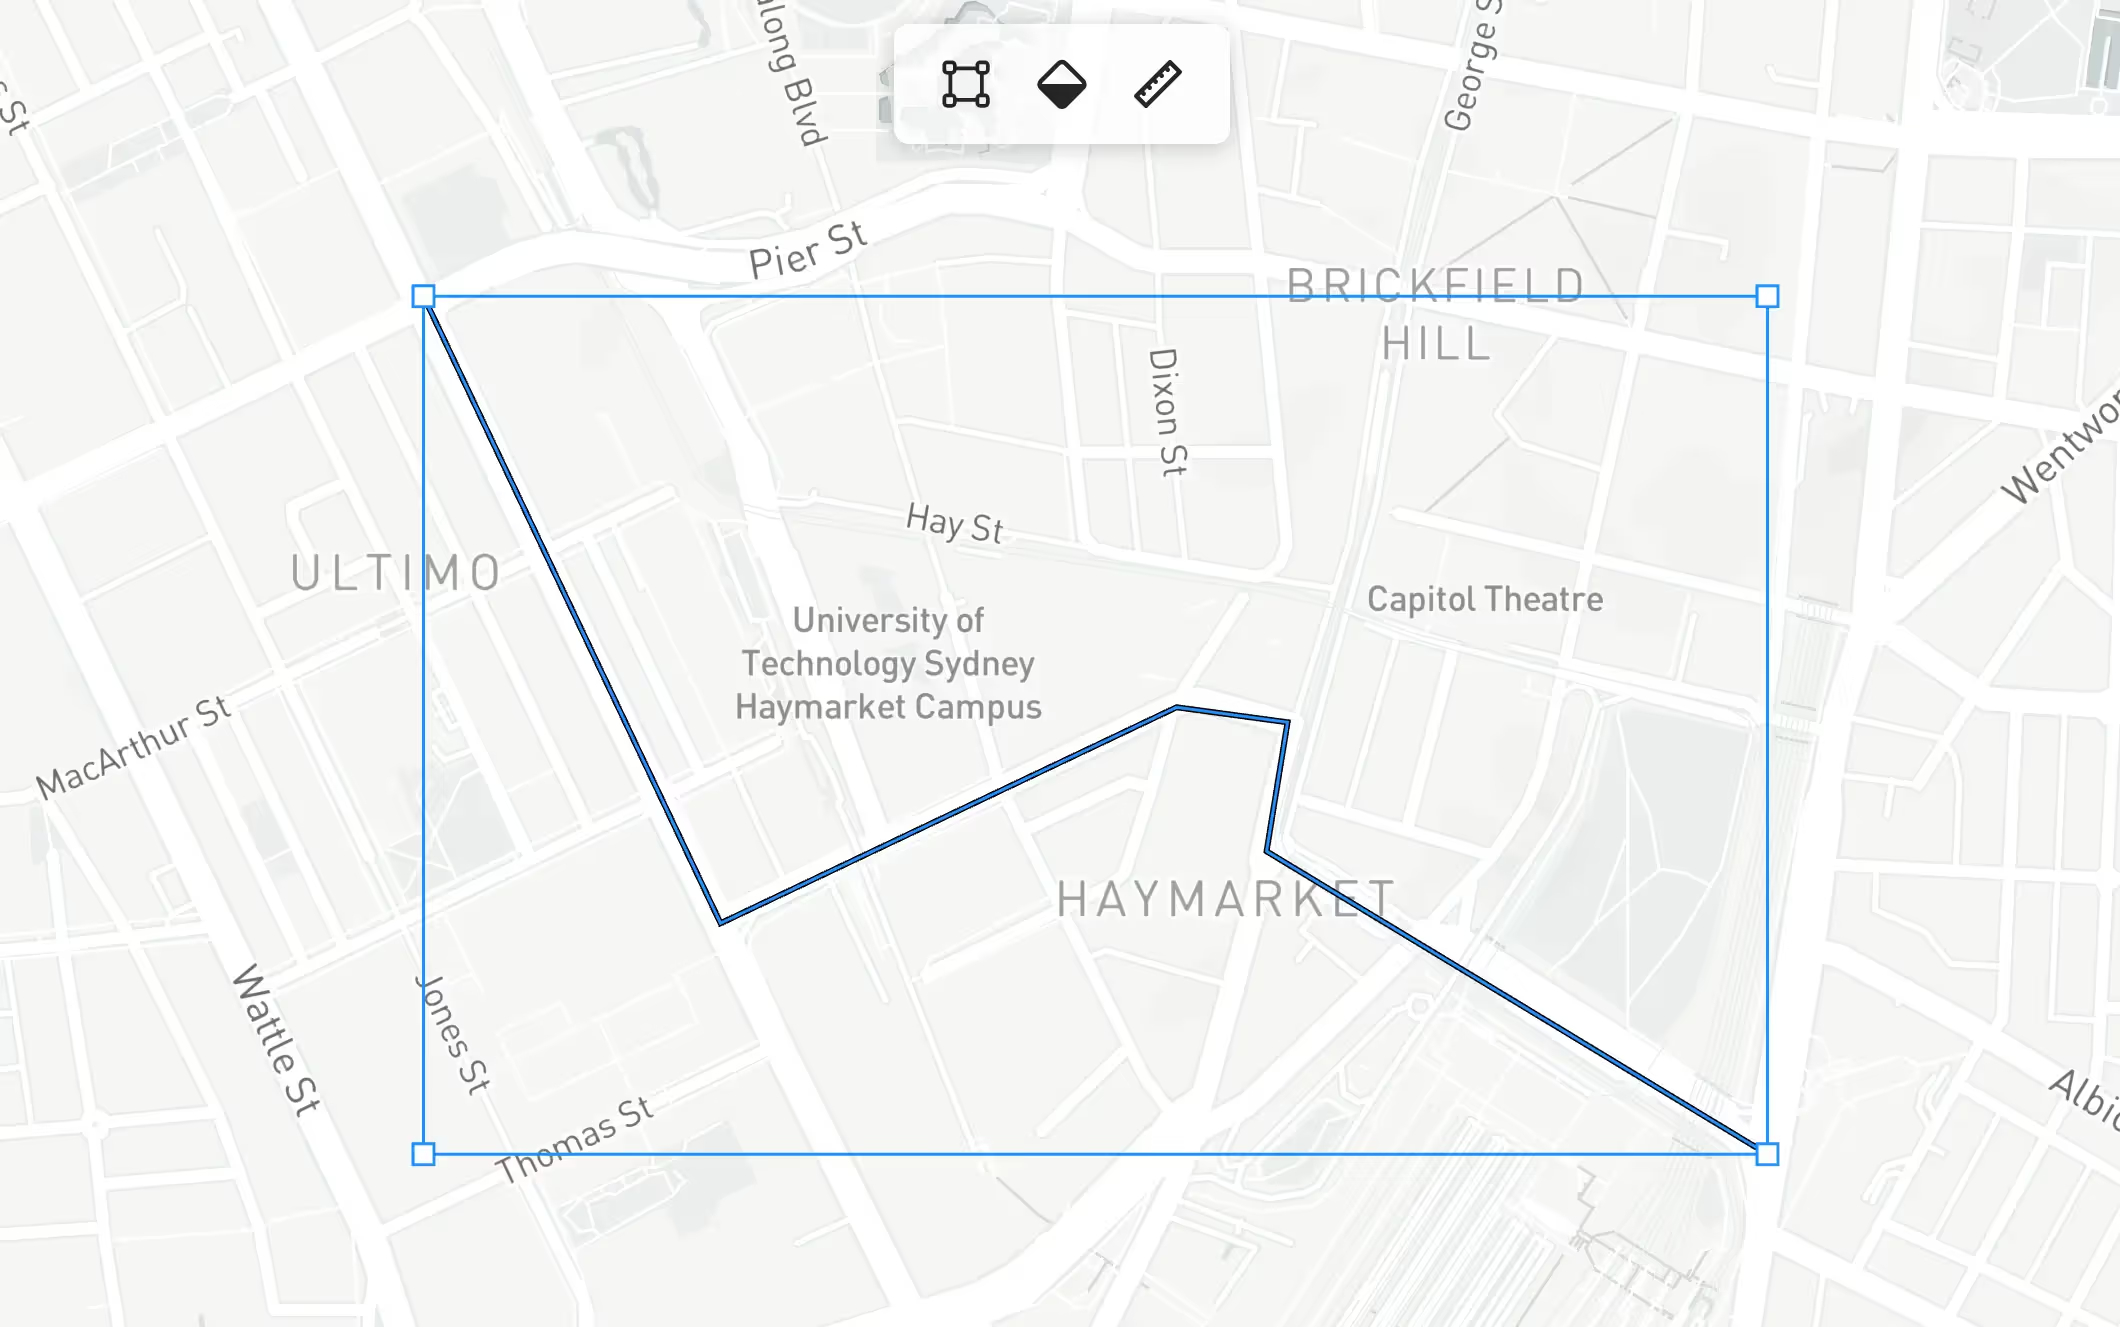
Turbomaps works a bit like a graphics editor—you can just click on a layer to move it around, resize it, or rotate it. Layers are shown in the sidebar to make it quick to select and organize all the data on your map. I think the editing tools do a great job at treading the line between too basic (like a mobile app) and too complicated (like traditional GIS software).
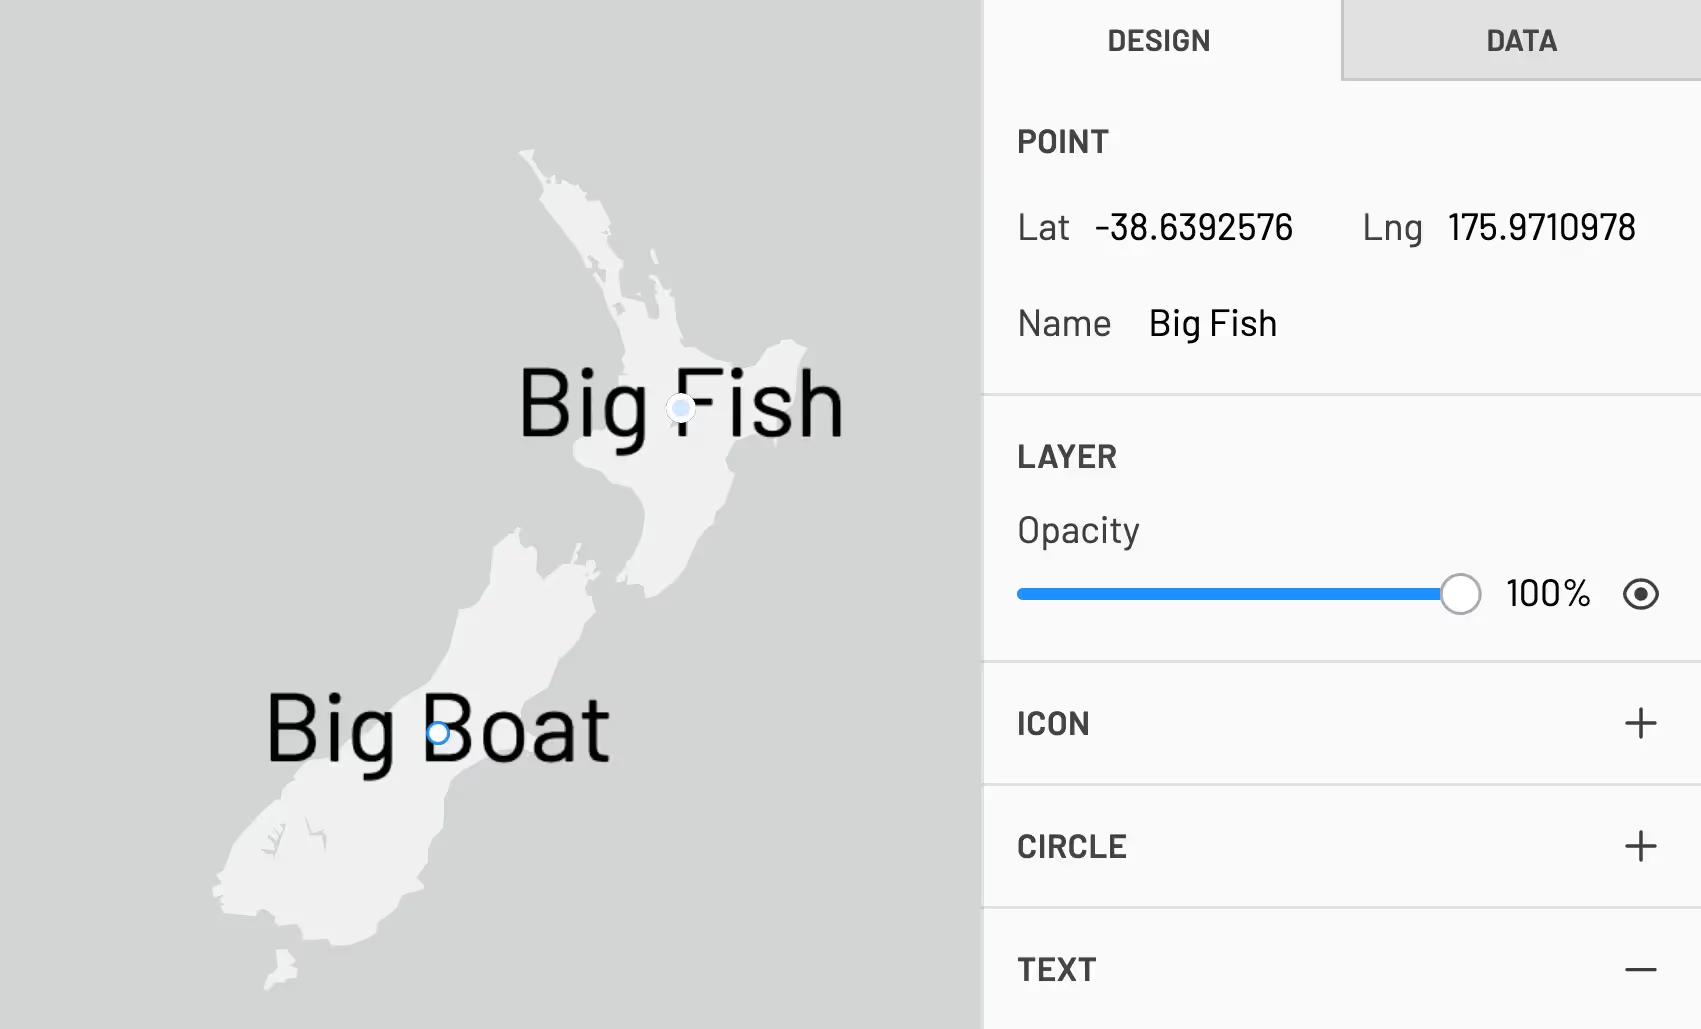
Plenty of styling options
I’m starting to build out the design options for the different types of data. The basics are in—you can choose your colors and whether your points are pins, circles, or text (or all three!) The challenge now is managing the sizes of objects. You may want the features on your map to be represented at their physical size, a size in pixels, but likely a combination of both—so the right things are prioritized at the different zoom levels.
There’s also a few styles for the basemap included—light, dark, streets, or satellite. You can also turn the map labels on or off. I’m planning on including many more options here in the future—potentially even different providers (e.g Google Maps). However, the focus is not for Turbomaps to become a general basemap design tool.
Work with the data directly
You can often find yourself working with geospatial data inadvertently—often when using data from somewhere else. It’s pretty handy to be able to copy this data out and visualize it, perhaps making changes, depending on the scenario. Turbomaps is designed to support this workflow—you can drop or copy in any GeoJSON data, edit it directly on the map or with the built-in data editor, and copy it right back out again.
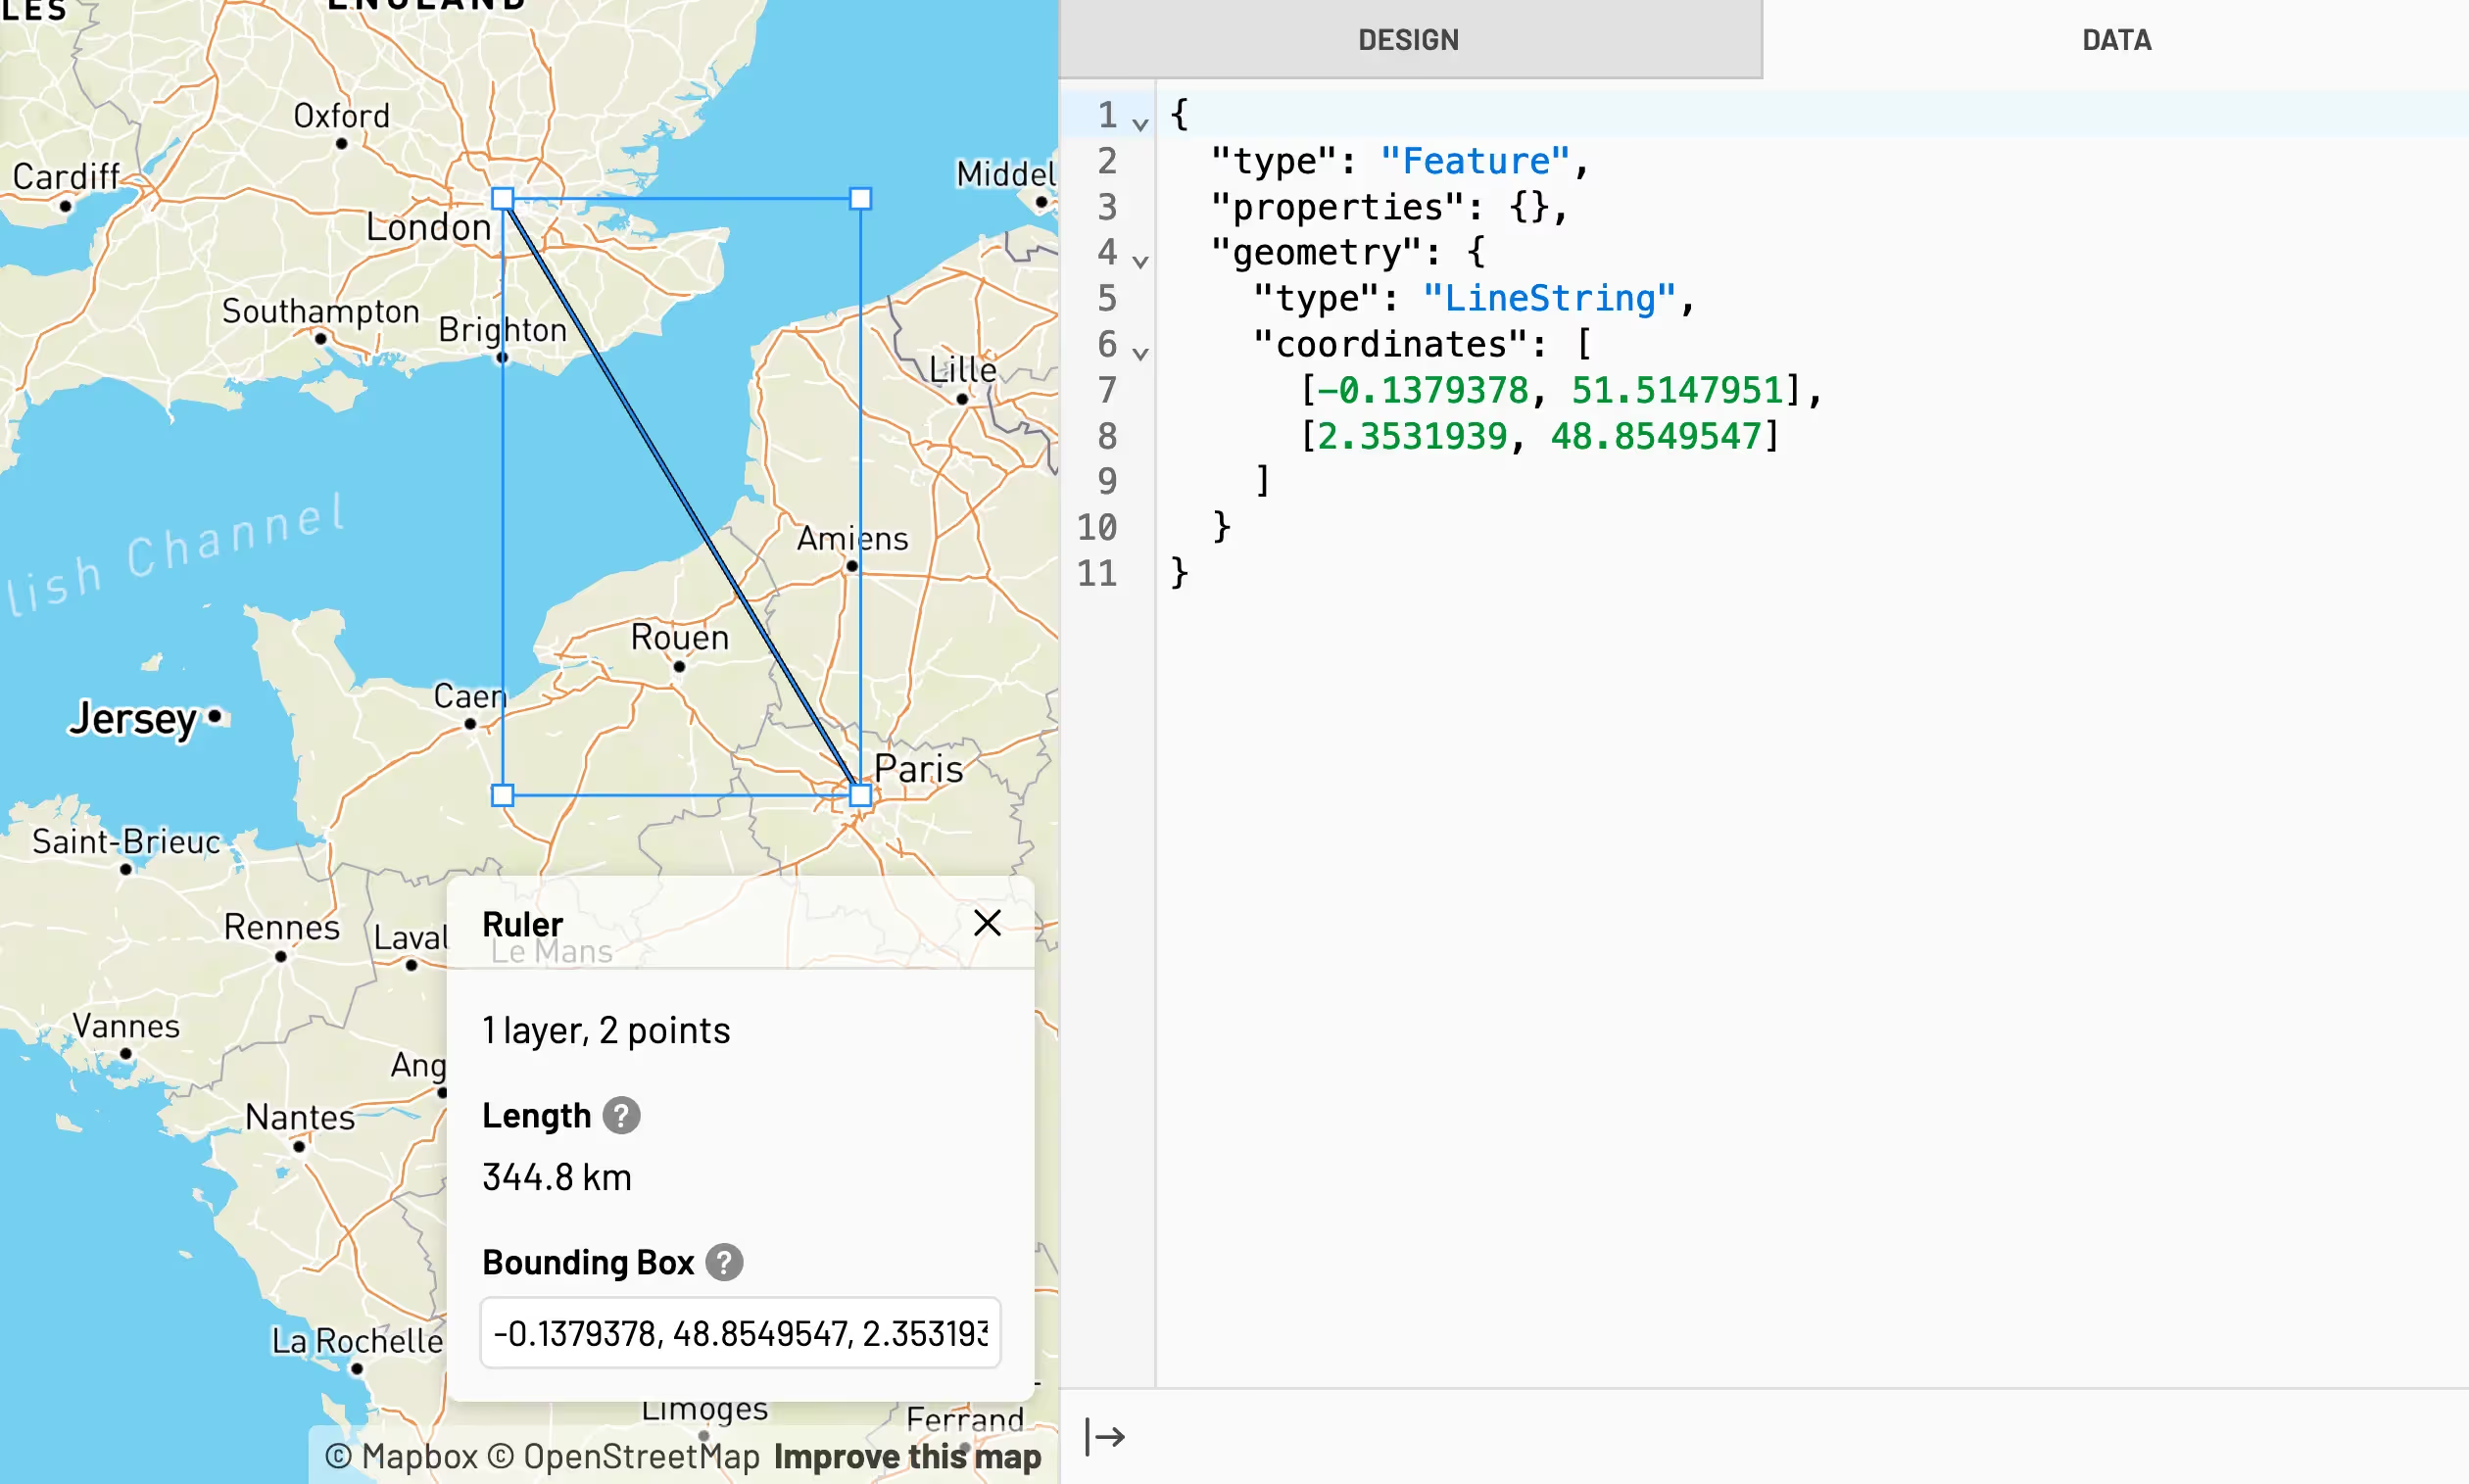
There’s also now a ruler tool that can tell you some information about your layer. I find it super handy if you want to know the distance between two places as the crow flies (surprisingly hard to do in Google Maps!), or finding out the area of a place in the world.
What’s next?
There’s been a lot done since the last update, but there’s still a few things to do before the public release. I’m working on finishing up the design options in the editor, and continuing to tweak things so they feel really good to use.
The larger piece of work coming up is to build out the server side part of Turbomaps—signing up, logging in, and storing maps. Luckily, every web app needs these things, so it’s easy to get these up and running quickly when you’re starting from scratch.