Editing Tools
Layer Types
There are a number of different layer types in Turbomaps. These are all displayed differently on the map, and have different design options.
Points
A point is a single coordinate—for example, an address or location. These can be shown on your map as circles, text labels, or both.
You can edit a point layer to have multiple points, but all points will share the same name. Use a group with multiple point layers to bulk manage points.
Lines
A line is a set of coordinates in sequence—for example, a street or path. A line layer can contain multiple line segments that do not have to be joined together.
Lines are shown on the map with a stroke of constant width. As you zoom, the line length will grow/shrink, but the width will remain constant. You can add text to lines, which is drawn above the stroke.
Line layers can be converted to polygon layers by using the fill object tool.
Polygons
A polygon is a set of coordinates that encloses an area—for example, a city or region. Polygons can have holes inside them, and polygon layers can contain many polygons.
Polygons can be shown on the map with a constant width stroke (like line layers), with a fill that highlights the enclosed area, and with text placed inside the enclosed area.
Polygon layers can be converted to line layers by using the fill object tool.
Basemap
The basemap is the world map that acts as the base layer underneath all other layers. This basemap is present in every map and cannot be removed, but can be hidden.
There are a number of different basemap designs available, and the basemap opacity can be adjusted.
Bulk Editing
Multiple layers can be selected by using ctrl+click in the map or sidebar. You can then edit on the map, update multiple properties in the sidebar, or perform commands on all these layers all at once.
In the sidebar, you can also use shift+click to select many layers at once.
Groups
Groups are a helpful way to keep your layers organized. You can group existing layers by selecting them with ctrl+click, and right clicking to choose the Group Selection option. Groups are also automatically created when you have another layer selected and you add a new layer.
If you select a group, you can edit all the sublayers at once. On the map, you can double click a layer within a group to select it. If you have nested groups, you can double click several times to traverse selection through the group.
Right click a group and select ungroup to remove the group but keep the inner layers. You may not be able to ungroup if it will exceed the system limits.
Command Bar
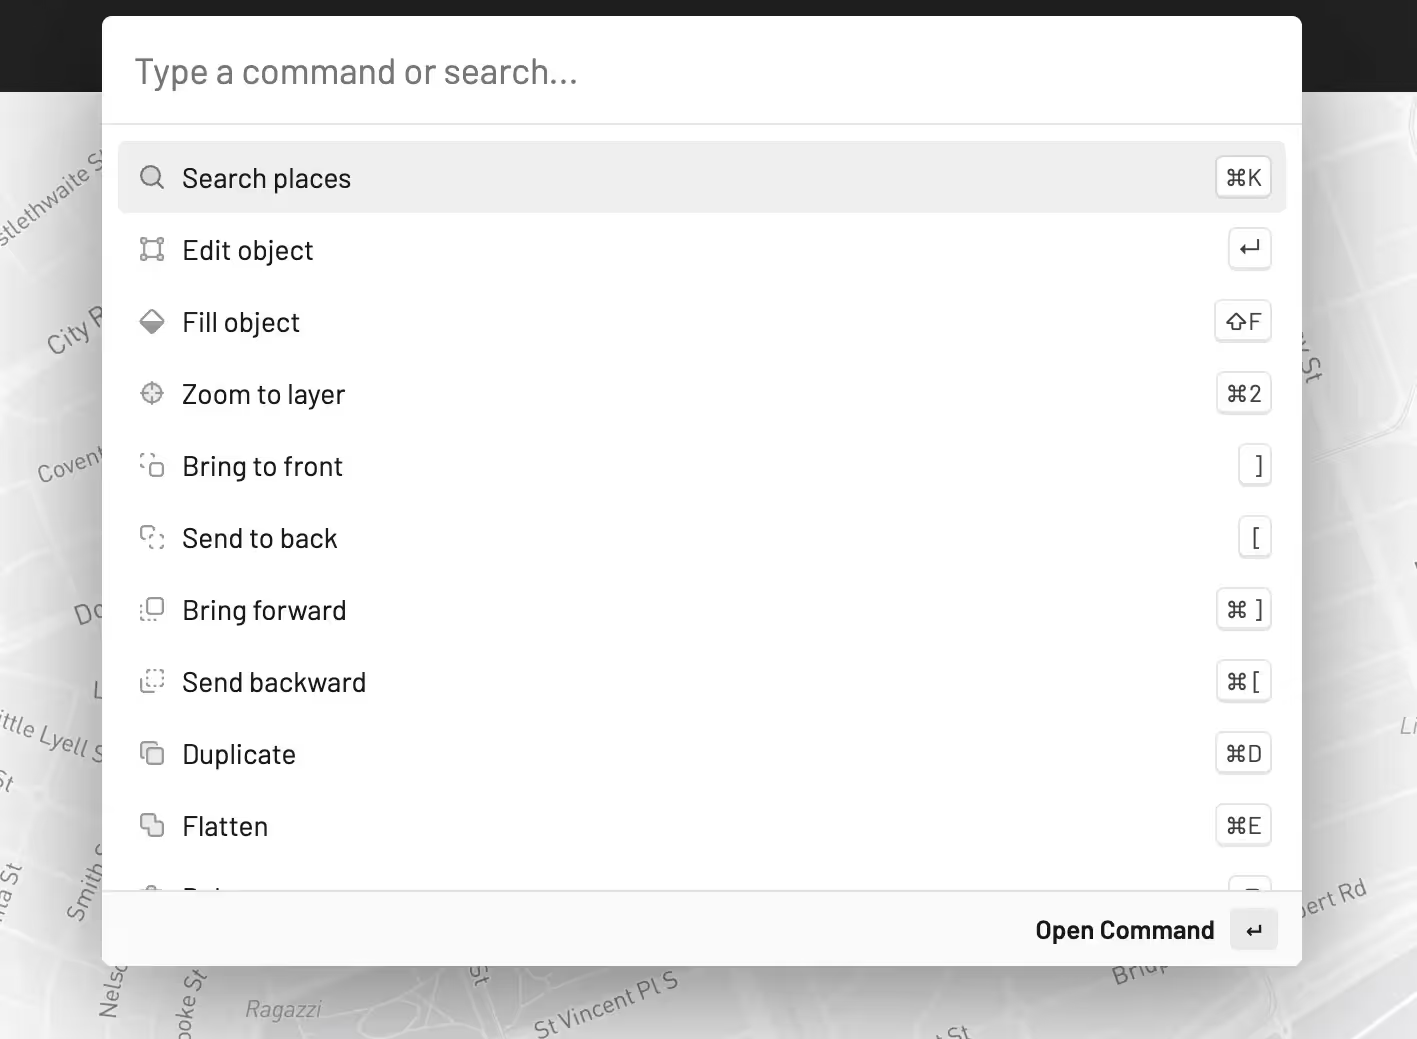
Most app commands can be found from the command bar. Select Search or press / to bring up the command bar. If a layer or individual point is selected, more commands will be available.

Data Editor
Each layer has underlying GeoJSON data that can be edited in the data editor.
To edit or view a layer as GeoJSON, select a single layer and select the data tab in the sidebar
Any changes you make to GeoJSON data within the data editor is validated. A layer will not be updated if the GeoJSON data is invalid.
Other Tools
Ruler
Layers can be measured using the ruler tool. You can select one or many layers to measure distance, area, and number of points.
Map Navigation
You can position the map or zoom to particular layers by using the controls in the zoom menu in the top right corner.
Reordering Layers
You can reorder layers by right clicking and choosing send to front or send to back which will reorder to the top or bottom of your file.
Alternatively, you can use send forward or send backwards which will shift the layer up or down one position.
Undo / Redo
Every change you make can be reversed and redone by choosing undo or redo respectively.
Current Limitations
- You cannot currently make a duplicate of an entire group.
- Your undo history is kept while you are in the editor. If you leave the editor, you will not be able to undo changes you made in a previous session.
- Layers and coordinates within layers cannot currently be copy/pasted directly. As a workaround, you can right click a layer and choose duplicate or copy the GeoJSON data directly from the data editor.